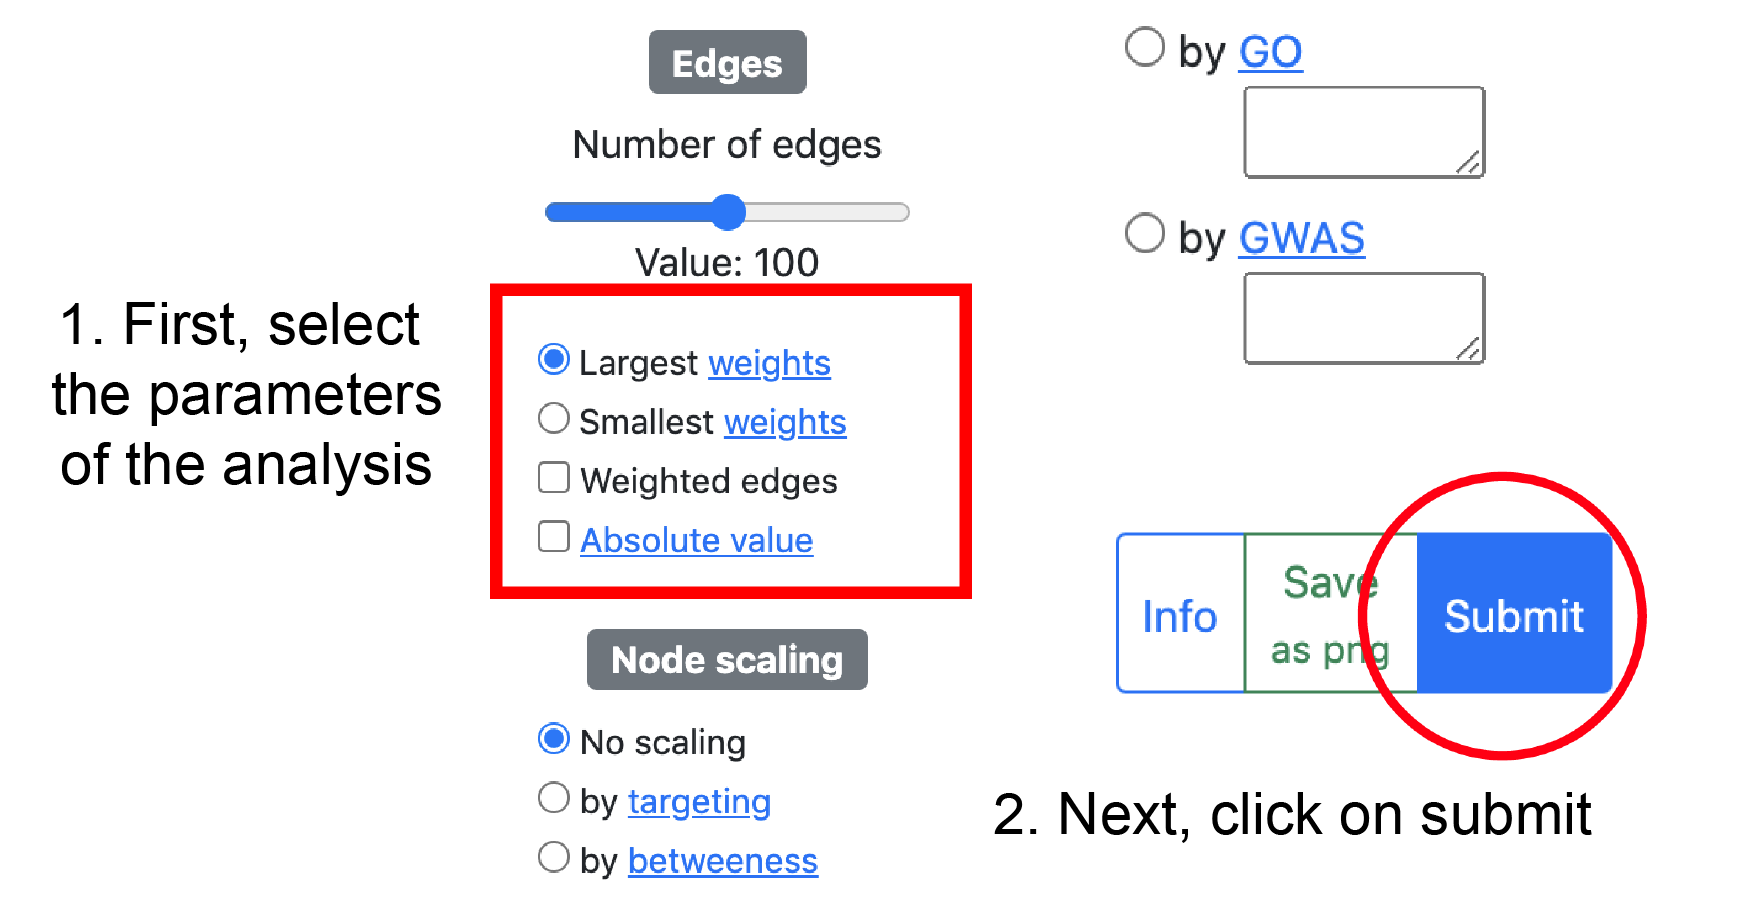
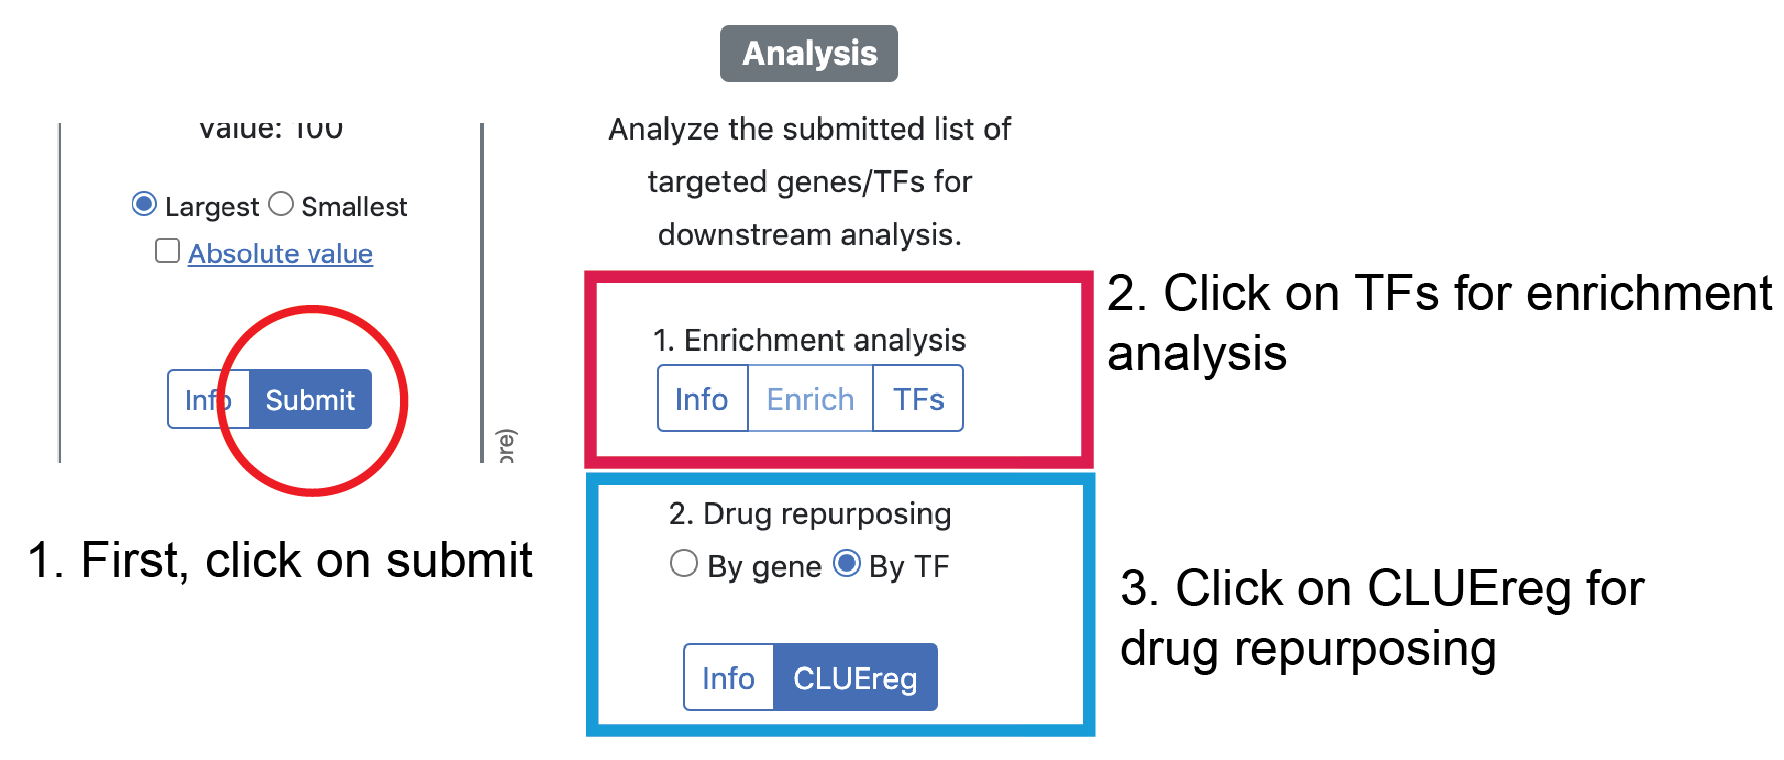
Please click on the submit button after selecting the parameters to retrieve the network from the server.
Loading network, please wait.


Network information
A set of networks in normal and cancer tissues have been generated using the same processing pipeline: The normal tissue networks are the ones that were generated in Sonwane et al. and available in the tissues section, and the cancer networks are available in the download section. The processing pipeline can can be accessed in netbooks under "Generating 26 cancer gene regulatory network using TCGA datasets".
To plot a differential network, first the first network (e.g., cancer) and the second network (e.g., normal tissue) can be selected from the dropdown menu and after clicking submit, the differential network is plotted by the specified parameters. Selecting 'weighted edges' option allows to plot edge thickness by the edge weight. Positive edge weights (network 2 > network 1) are plotted in green and negative edge weights (network 1 > network 2) are plotted in red.
To plot a differential network, first the first network (e.g., cancer) and the second network (e.g., normal tissue) can be selected from the dropdown menu and after clicking submit, the differential network is plotted by the specified parameters. Selecting 'weighted edges' option allows to plot edge thickness by the edge weight. Positive edge weights (network 2 > network 1) are plotted in green and negative edge weights (network 1 > network 2) are plotted in red.
Edge weights table
| Source | Target | Edge weight |
|---|
Network information
A set of networks in normal and cancer tissues have been generated using the same processing pipeline: The normal tissue networks are the ones that were generated in Sonwane et al. and available in the tissues section, and the cancer networks are available in the downlaod section. The processing pipeline can can be accessed in netbooks under "Generating 26 cancer gene regulatory network using TCGA datasets".
To plot a differential network, first the first network (e.g., cancer) and the second network (e.g., normal tissue) can be selected from the dropdown menu and after clicking submit, the differential network is plotted by the specified parameters. Selecting 'weighted edges' option allows to plot edge thickness by the edge weight. Positive edge weights (network 2 > network 1) are plotted in green and negative edge weights (network 1 > network 2) are plotted in red.
To plot a differential network, first the first network (e.g., cancer) and the second network (e.g., normal tissue) can be selected from the dropdown menu and after clicking submit, the differential network is plotted by the specified parameters. Selecting 'weighted edges' option allows to plot edge thickness by the edge weight. Positive edge weights (network 2 > network 1) are plotted in green and negative edge weights (network 1 > network 2) are plotted in red.
Gene Targeting score
| Gene | Targeting score |
|---|
TF Targeting score
| Regulator | Targeting score |
|---|