First upload the file in the first tab. Then, in the second tab, please click on the submit button after selecting the parameters to retrieve the network from the server.
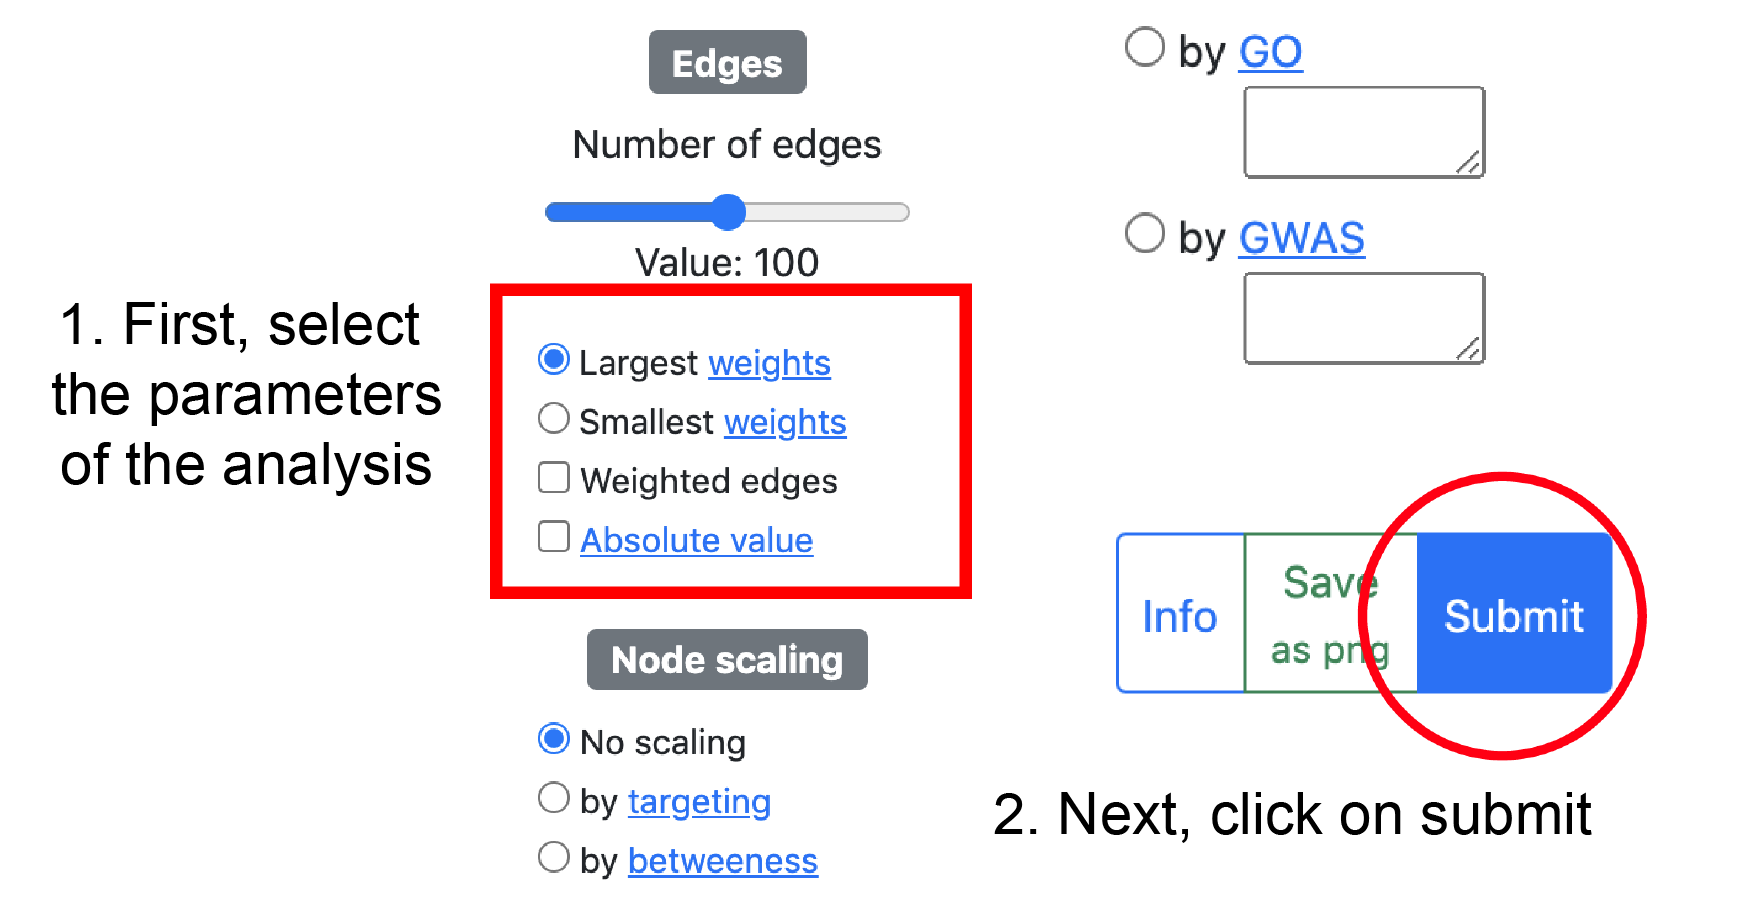


Edges
Edge weights table
| Source | Target | Edge weight |
|---|
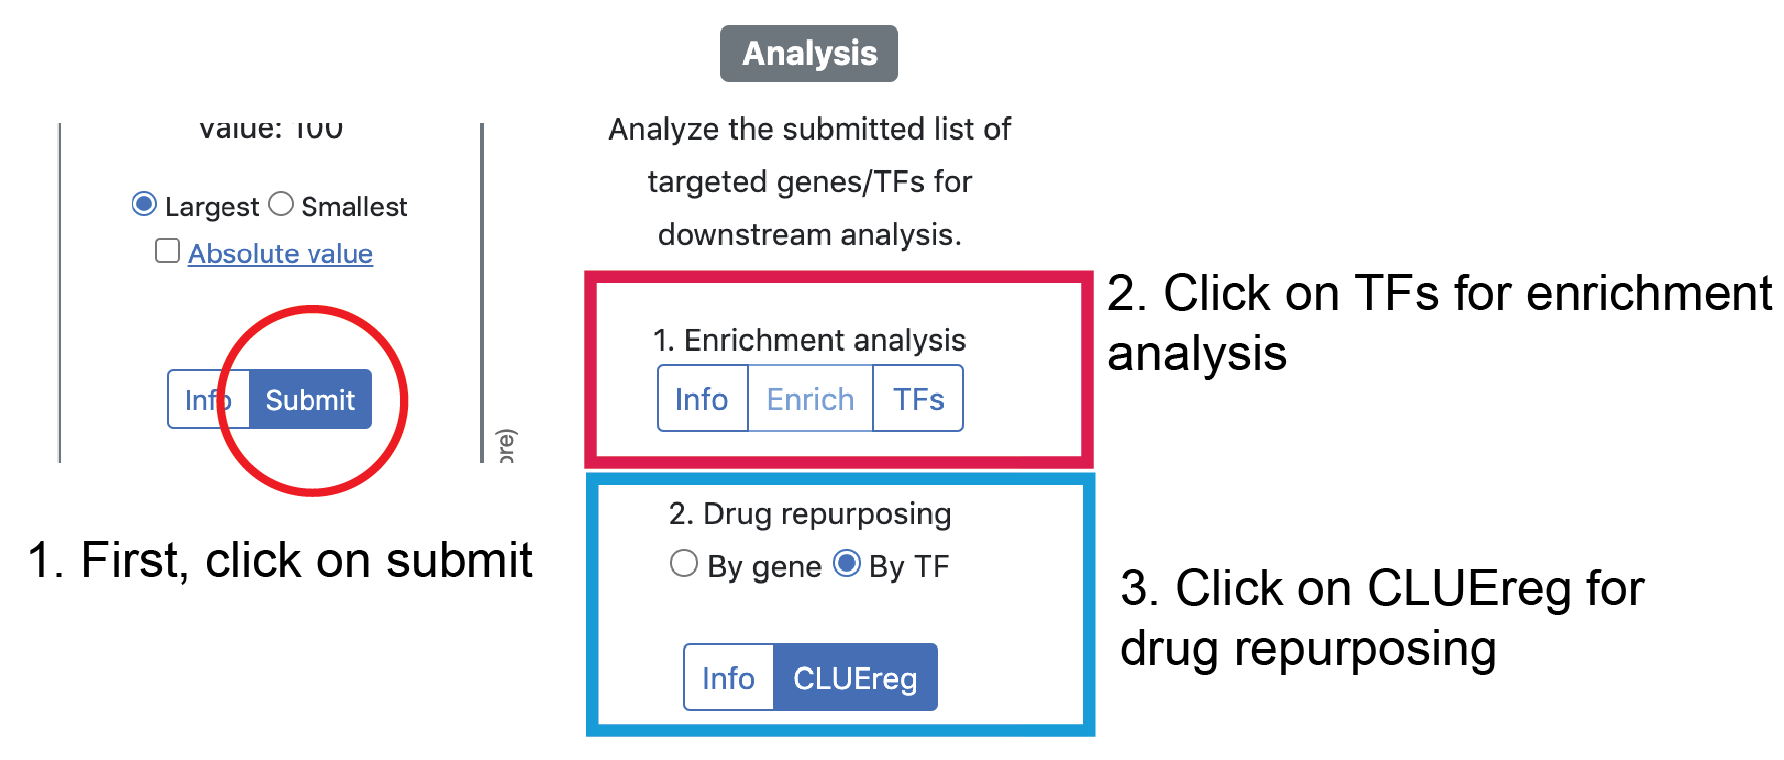
First upload the file in the first tab. Then, in the second tab, please click on the submit button after selecting the parameters to retrieve the network from the server.
| Source | Target | Edge weight |
|---|